Our Emissions
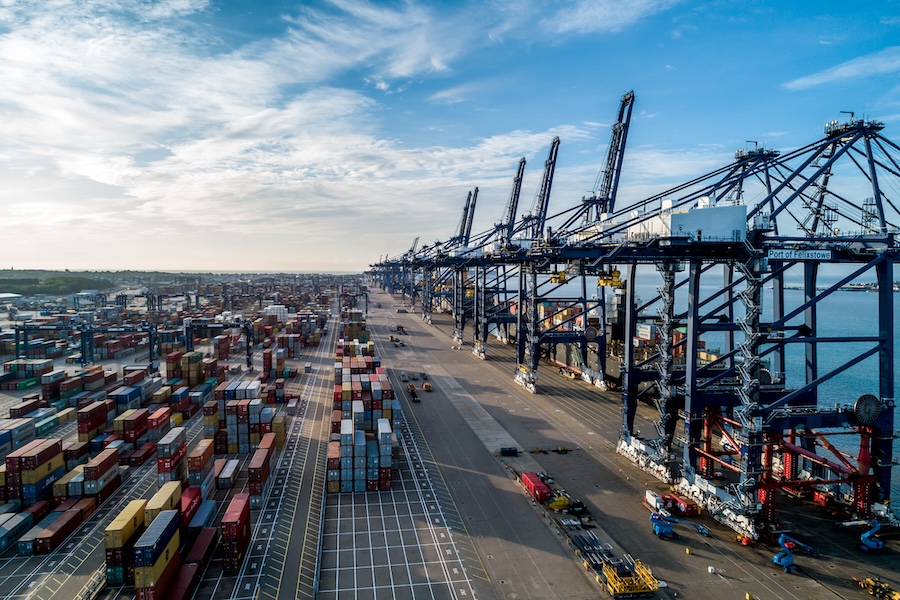
Hutchison Ports prioritise decarbonising its operations and continually improving its environmental performance. Aligning with the goals set out in the Paris Agreement, we have set science-based targets to reach net-zero by 2050.In our emission profile, our scope 1 emissions mainly come from the operation of port equipment including movable carriers, cranes and other ancillary equipment such as generators. Our scope 2 emissions are mostly caused by operating reefer units, electrified cranes and office buildings.
We strive to reduce our emissions through equipment electrification and energy transition programme. We have developed a net-zero roadmap and full-scale electrification of equipment will begin in 2024. With the anticipated growing demand of electricity consumption, the Group is exploring the use of electricity from renewable sources and the feasibility of adopting green fuel. While aiming for a sustainable port development and maintaining resilience towards global challenges, the Group works proactively in exploring other green initiatives and collaborating with our stakeholders to progress our emissions reduction journey.
Our Carbon Footprint
2022
|
|
|
2021
|
|
|
Region
Year
2022
2022
Port
Scope 1 Emissions
Scope 2 Emissions
CO2 Intensity
Hutchison Ports Ajman (United Arab Emirates)
Scope 1 Emissions
6,969
tonne CO2e
Scope 2 Emissions
3,054
tonne CO2e
CO2 Intensity
44.12
kg CO2e/TEU
Hutchison Ports Alexandria (Egypt)
Scope 1 Emissions
14,066
tonne CO2e
Scope 2 Emissions
8,637
tonne CO2e
CO2 Intensity
32.65
kg CO2e/TEU
Hutchison Ports BEST (Spain)
Scope 1 Emissions
9,583
tonne CO2e
Scope 2 Emissions
0
tonne CO2e
CO2 Intensity
3.83
kg CO2e/TEU
Hutchison Ports Brisbane (Australia)
Scope 1 Emissions
969
tonne CO2e
Scope 2 Emissions
3,918
tonne CO2e
CO2 Intensity
24.00
kg CO2e/TEU
Hutchison Ports Busan (South Korea)
Scope 1 Emissions
10,460
tonne CO2e
Scope 2 Emissions
9,802
tonne CO2e
CO2 Intensity
10.55
kg CO2e/TEU
Hutchison Ports Delta II (The Netherlands)
Scope 1 Emissions
9,825
tonne CO2e
Scope 2 Emissions
9,520
tonne CO2e
CO2 Intensity
12.42
kg CO2e/TEU
Hutchison Ports ECT Rotterdam (The Netherlands)
Scope 1 Emissions
39,439
tonne CO2e
Scope 2 Emissions
49,099
tonne CO2e
CO2 Intensity
10.85
kg CO2e/TEU
Hutchison Ports ECV (Mexico)
Scope 1 Emissions
11
tonne CO2e
Scope 2 Emissions
163
tonne CO2e
CO2 Intensity
-
kg CO2e/TEU
Hutchison Ports EIT (Mexico)
Scope 1 Emissions
4,390
tonne CO2e
Scope 2 Emissions
2,101
tonne CO2e
CO2 Intensity
14.55
kg CO2e/TEU
Hutchison Ports FCP (Bahamas)
Scope 1 Emissions
14,448
tonne CO2e
Scope 2 Emissions
9,462
tonne CO2e
CO2 Intensity
15.19
kg CO2e/TEU
Hutchison Ports Gdynia (Poland)
Scope 1 Emissions
2,716
tonne CO2e
Scope 2 Emissions
4,414
tonne CO2e
CO2 Intensity
18.20
kg CO2e/TEU
Hutchison Ports Gwangyang (South Korea)
Scope 1 Emissions
4,450
tonne CO2e
Scope 2 Emissions
3,603
tonne CO2e
CO2 Intensity
10.39
kg CO2e/TEU
Hutchison Ports ICAVE (Mexico)
Scope 1 Emissions
12,366
tonne CO2e
Scope 2 Emissions
6,556
tonne CO2e
CO2 Intensity
17.20
kg CO2e/TEU
Hutchison Ports Jazan (Saudi Arabia)
Scope 1 Emissions
210
tonne CO2e
Scope 2 Emissions
720
tonne CO2e
CO2 Intensity
35.37
kg CO2e/TEU
Hutchison Ports KICT (Pakistan)
Scope 1 Emissions
14,959
tonne CO2e
Scope 2 Emissions
2,280
tonne CO2e
CO2 Intensity
25.34
kg CO2e/TEU
Hutchison Ports LCMT (Mexico)
Scope 1 Emissions
307
tonne CO2e
Scope 2 Emissions
250
tonne CO2e
CO2 Intensity
16.59
kg CO2e/TEU
Hutchison Ports LCT (Mexico)
Scope 1 Emissions
5,616
tonne CO2e
Scope 2 Emissions
6,487
tonne CO2e
CO2 Intensity
8.86
kg CO2e/TEU
Hutchison Ports MITT (Myanmar)
Scope 1 Emissions
1,991
tonne CO2e
Scope 2 Emissions
836
tonne CO2e
CO2 Intensity
14.75
kg CO2e/TEU
Hutchison Ports PPC (Panama)
Scope 1 Emissions
20,786
tonne CO2e
Scope 2 Emissions
7,548
tonne CO2e
CO2 Intensity
8.53
kg CO2e/TEU
Hutchison Ports Pakistan
Scope 1 Emissions
24,148
tonne CO2e
Scope 2 Emissions
0
tonne CO2e
CO2 Intensity
29.10
kg CO2e/TEU
Hutchison Ports RAK (United Arab Emirates)
Scope 1 Emissions
522
tonne CO2e
Scope 2 Emissions
683
tonne CO2e
CO2 Intensity
21.90
kg CO2e/TEU
Hutchison Ports SITV (Vietnam)
Scope 1 Emissions
72
tonne CO2e
Scope 2 Emissions
1,942
tonne CO2e
CO2 Intensity
5.15
kg CO2e/TEU
Hutchison Ports Sohar (Oman)
Scope 1 Emissions
9,827
tonne CO2e
Scope 2 Emissions
7,327
tonne CO2e
CO2 Intensity
23.67
kg CO2e/TEU
Hutchison Ports Stockholm (Sweden)
Scope 1 Emissions
490
tonne CO2e
Scope 2 Emissions
9
tonne CO2e
CO2 Intensity
9.34
kg CO2e/TEU
Hutchison Ports Sydney (Australia)
Scope 1 Emissions
2,224
tonne CO2e
Scope 2 Emissions
6,030
tonne CO2e
CO2 Intensity
18.64
kg CO2e/TEU
Hutchison Ports TILH (Mexico)
Scope 1 Emissions
643
tonne CO2e
Scope 2 Emissions
270
tonne CO2e
CO2 Intensity
-
kg CO2e/TEU
Hutchison Ports TIMSA (Mexico)
Scope 1 Emissions
9,192
tonne CO2e
Scope 2 Emissions
1,050
tonne CO2e
CO2 Intensity
21.80
kg CO2e/TEU
Hutchison Ports TNG (Mexico)
Scope 1 Emissions
1,067
tonne CO2e
Scope 2 Emissions
2,921
tonne CO2e
CO2 Intensity
-
kg CO2e/TEU
Hutchison Ports Thailand
Scope 1 Emissions
22,093
tonne CO2e
Scope 2 Emissions
21,192
tonne CO2e
CO2 Intensity
11.61
kg CO2e/TEU
Hutchison Ports UAQ (United Arab Emirates)
Scope 1 Emissions
453
tonne CO2e
Scope 2 Emissions
323
tonne CO2e
CO2 Intensity
27.69
kg CO2e/TEU
Hutchison Ports United Kingdom
Scope 1 Emissions
29,216
tonne CO2e
Scope 2 Emissions
0
tonne CO2e
CO2 Intensity
8.39
kg CO2e/TEU
Remarks:
-
Scope 1 Emissions (tonne CO2e) is the GHG emissions from sources that are owned or controlled by the port.
-
Scope 2 Emissions (tonne CO2e) is the GHG emissions from the generation of purchased electricity, steam, heat and cooling.
-
Carbon Intensity (kg CO2e/TEU), is the total of Scope 1 and Scope 2 GHG Emissions divided by the port’s annual throughput.
-
The emission factors applied for the calculation of Scope 1 are adopted from the U.S. Environmental Protection Agency and Department for Environment, Food, and Rural Affairs (UK).
-
The emission factors applied for the calculation of Scope 2 GHG Emissions are adopted from the International Energy Agency.

